9. Epidemic modeling, deterministic and stochastic models#
import networkx as nx
import numpy as np
from operator import itemgetter
from collections import defaultdict
import matplotlib.ticker as ticker
import matplotlib.pyplot as plt
import seaborn as sns
%pylab inline
%pylab is deprecated, use %matplotlib inline and import the required libraries.
Populating the interactive namespace from numpy and matplotlib
9.1. The deterministic SIR model#
As a first step, we solve the differential equations of an SIR model with the Euler method.
We set the parameters of the model
mu = 0.2
R0 = 1.8
beta1 = R0 * mu
beta1
0.36000000000000004
print("The average infectious period is ", 1.0 / mu, " days")
The average infectious period is 5.0 days
The time step of integration is 1 day.
N = 1000000
I = 100
S = N - I
R = 0

St = []
It = []
Rt = []

deltaSt = []
deltaIt = []

St.append(S)
It.append(I)
Rt.append(R)

while I > 0.01:

    deltaSI = beta1 * float(I) * S / N

    deltaIR = mu * I

    S = S - deltaSI
    I = I + deltaSI - deltaIR
    R = R + deltaIR

    deltaSt.append(deltaSI)
    deltaIt.append(deltaIR)
    St.append(S)
    It.append(I)
    Rt.append(R)
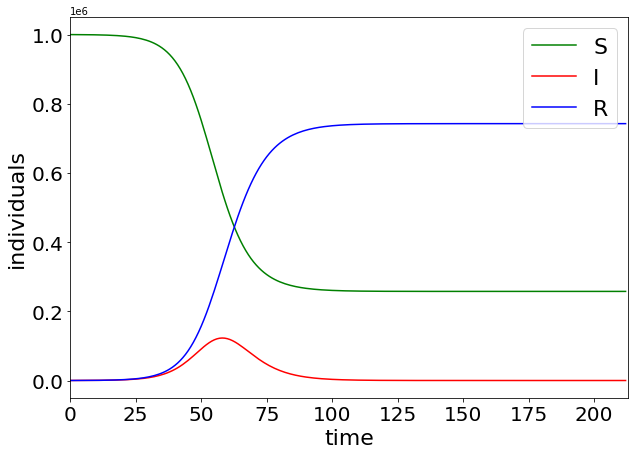
print("The final attack rate is ", Rt[-1] / N)
The final attack rate is 0.7424651228152364
We plot the time varying curves of S, I and R
plt.figure(figsize=(10, 7))

plt.plot(range(0, len(St)), np.array(St), label="S", color="g")
plt.plot(range(0, len(It)), np.array(It), label="I", color="r")
plt.plot(range(0, len(Rt)), np.array(Rt), label="R", color="b")

# plt.yscale('log')
# plt.xscale('log')
plt.xlim([0, len(It)])

plt.xticks(fontsize=20)
plt.yticks(fontsize=20)
plt.xlabel("time", fontsize=22)
plt.ylabel("individuals", fontsize=22)

plt.legend(loc="upper right", fontsize=22)
# plt.yscale('log')
# plt.xscale('log')
<matplotlib.legend.Legend at 0x16898a070>
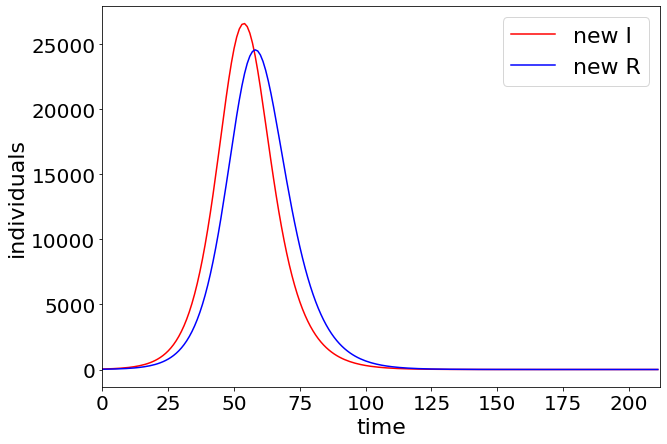
plt.figure(figsize=(10, 7))

plt.plot(range(0, len(deltaSt)), np.array(deltaSt), label="new I", color="r")
plt.plot(range(0, len(deltaIt)), np.array(deltaIt), label="new R", color="b")
# plt.plot(range(0, len(Rt)),np.array(Rt), label='R', color='b')

# plt.yscale('log')
plt.xlim([0, len(deltaIt)])

plt.xticks(fontsize=20)
plt.yticks(fontsize=20)
plt.xlabel("time", fontsize=22)
plt.ylabel("individuals", fontsize=22)

plt.legend(loc="upper right", fontsize=22)
<matplotlib.legend.Legend at 0x168fe1070>
9.2. The stochastic SIR#
We simulate a discrete and stochastic SIR model by randomly extracting the transition elements at each time step. Since the simulations are stochastic, we need to run several realizations of the model and then extract their statistical averages.
We use the same model’s parameters: \(R_0=3.0\)
mu = 0.2
R0 =  1.8
beta1 = R0 * mu
dict_I = defaultdict(list) # here we store the number of I at each time step, for each run
final_R = []

nrun = 1000

Irun = []

for r in range(0, nrun):

    # for each run r, we set the initial conditions
    N = 1000000
    I = 100
    S = N - I
    R = 0

    list_I = []
    list_I.append(I)

    t = 0
    dict_I[t].append(I)

    while I > 0:

        p = beta1 * (float(I) / N)
        deltaSI = np.random.binomial(S, p)

        deltaIR = np.random.binomial(I, mu)

        S = S - deltaSI
        I = I + deltaSI - deltaIR
        R = R + deltaIR

        t += 1
        list_I.append(I)

        dict_I[t].append(I)

    final_R.append(float(R) / N)
    Irun.append(list_I)

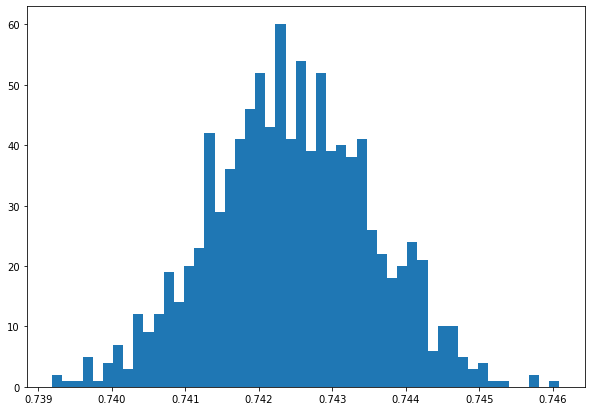
print("The average final attack rate is ", np.average(np.array(final_R)))
The average final attack rate is 0.742447461
plt.figure(figsize=(10, 7))
a = plt.hist(final_R, bins=50)
plt.figure(figsize=(10, 7))

plt.xticks(fontsize=14)
plt.yticks(fontsize=14)

plt.xlabel("time", fontsize=18)
plt.ylabel("prevalence", fontsize=18)

for r in Irun:

    plt.plot(range(0, len(r)), r)
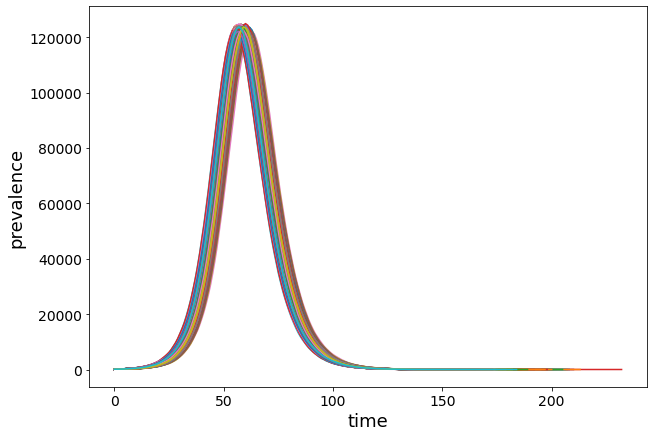
Too many lines are messy… let’s draw a boxplot
full_array = [np.array(dict_I[t]) for t in dict_I]

plt.figure(figsize=(10, 7))

plt.xlabel("time", fontsize=18)
plt.ylabel("prevalence", fontsize=18)

plt.xticks(fontsize=14)
plt.yticks(fontsize=14)

ax = sns.boxplot(data=full_array, color="skyblue")

ax.xaxis.set_major_locator(ticker.MultipleLocator(20))
ax.xaxis.set_major_formatter(ticker.ScalarFormatter())

plt.xlim([20, 60])
# plt.show()
(20.0, 60.0)
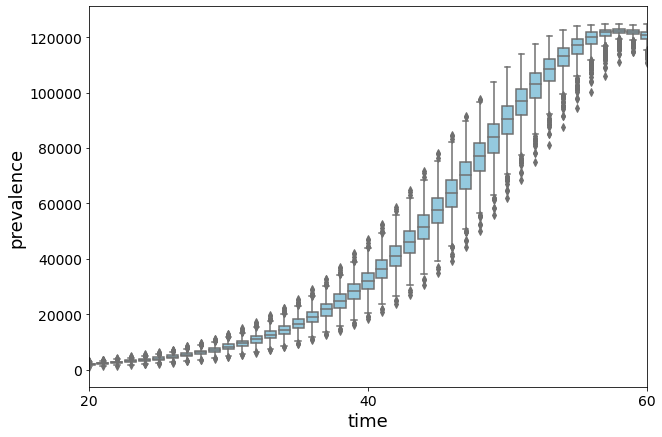
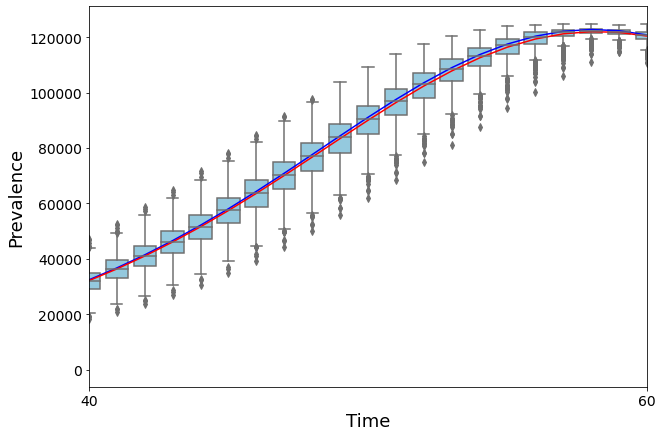
Let’s compare the result with the deterministic simulation by computing the average prevalence of the stochastic version.
full_average = [np.average(np.array(dict_I[t])) for t in dict_I]
plt.figure(figsize=(10, 7))

plt.xlabel("Time", fontsize=18)
plt.ylabel("Prevalence", fontsize=18)

plt.xticks(fontsize=14)
plt.yticks(fontsize=14)

ax = sns.boxplot(data=full_array, color="skyblue")

plt.plot(range(0, len(It)), It, color="b")
plt.plot(range(0, len(full_average)), full_average, color="r")

ax.xaxis.set_major_locator(ticker.MultipleLocator(20))
ax.xaxis.set_major_formatter(ticker.ScalarFormatter())

plt.xlim([40,60])
# plt.show()
(40.0, 60.0)
9.2.1. Dependence on the initial conditions#
The results of the stochastic version of the model depend on the initial conditions. Let’s change the initial number of infected individuals to 1.
mu = 0.2
R0 = 3.0
beta1 = R0 * mu
dict_I = defaultdict(
    list
)  # here we store the number of I at each time step, for each run

final_R = []

nrun = 1000
Irun = []
for r in range(0, nrun):

    # for each run r, we set the initial conditions
    N = 1000000
    I = 1
    S = N - I
    R = 0

    list_I = []

    t = 0
    dict_I[t].append(I)
    while I > 0:

        p = beta1 * (float(I) / N)
        deltaSI = np.random.binomial(S, p)

        deltaIR = np.random.binomial(I, mu)

        S = S - deltaSI
        I = I + deltaSI - deltaIR
        R = R + deltaIR

        t += 1
        list_I.append(I)

        dict_I[t].append(I)

    final_R.append(float(R) / N)
    Irun.append(list_I)

print("The average final attack rate is ", np.average(np.array(final_R)))
The average final attack rate is 0.7025336569999999
With only 1 infected as a seed, we see more fluctuations, as expected.
plt.figure(figsize=(10, 7))
plt.xlabel("time", fontsize=18)
plt.ylabel("prevalence", fontsize=18)

plt.xticks(fontsize=14)
plt.yticks(fontsize=14)

for r in Irun:

    plt.plot(range(0, len(r)), r)
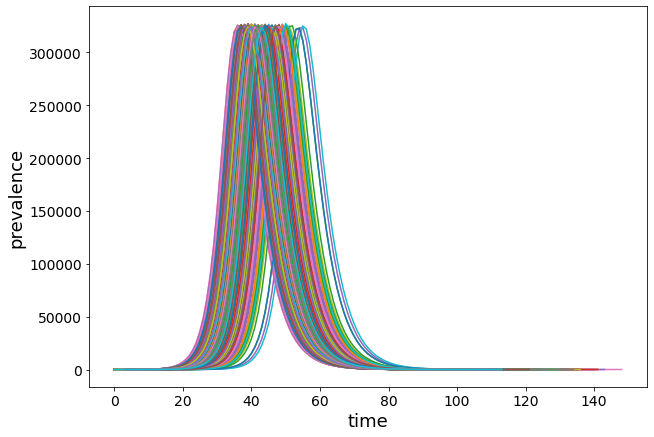
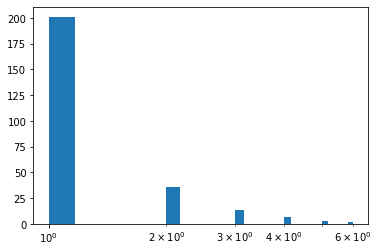
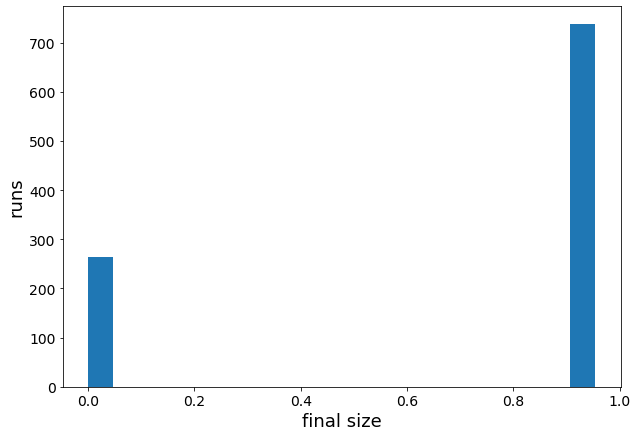
We have several runs without outbreak!
The initial seed individual recovers before infecting someone else.
no_outbreak = []
for r in final_R:
    if r < 0.8:
        no_outbreak.append(r * 1000000)
print(no_outbreak)
[1.0, 4.0, 1.0, 1.0, 1.0, 1.0, 1.0, 3.0, 1.0, 1.0, 1.0, 1.0, 1.0, 1.0, 1.0, 1.0, 4.0, 1.0, 1.0, 1.0, 1.0, 1.0, 1.0, 1.0, 1.0, 1.0, 1.0, 1.0, 4.0, 1.0, 1.0, 1.0, 1.0, 2.0, 1.0, 2.0, 1.0, 1.0, 1.0, 3.0, 1.0, 1.0, 1.0, 2.0, 1.0, 1.0, 1.0, 1.0, 1.0, 1.0, 2.0, 1.0, 1.0, 1.0, 1.0, 1.0, 1.0, 1.0, 1.0, 1.0, 2.0, 1.0, 1.0, 2.0, 1.0, 1.0, 1.0, 1.0, 1.0, 5.0, 1.0, 1.0, 1.0, 1.0, 5.0, 1.0, 3.0, 1.0, 1.0, 1.0, 2.0, 3.0, 1.0, 2.0, 1.0, 1.0, 1.0, 1.0, 2.0, 2.0, 3.0, 1.0, 1.0, 3.0, 2.0, 1.0, 1.0, 1.0, 1.0, 1.0, 1.0, 1.0, 1.0, 2.0, 1.0, 1.0, 1.0, 1.0, 1.0, 2.0, 1.0, 1.0, 1.0, 3.0, 1.0, 2.0, 2.0, 2.0, 1.0, 1.0, 1.0, 1.0, 1.0, 1.0, 2.0, 1.0, 1.0, 1.0, 1.0, 2.0, 1.0, 1.0, 4.0, 2.0, 1.0, 1.0, 1.0, 4.0, 1.0, 1.0, 6.0, 3.0, 1.0, 1.0, 3.0, 1.0, 2.0, 1.0, 1.0, 3.0, 1.0, 2.0, 1.0, 1.0, 1.0, 1.0, 1.0, 2.0, 1.0, 1.0, 1.0, 1.0, 1.0, 1.0, 1.0, 1.0, 1.0, 1.0, 1.0, 2.0, 1.0, 1.0, 2.0, 1.0, 1.0, 1.0, 1.0, 3.0, 1.0, 2.0, 1.0, 1.0, 1.0, 2.0, 2.0, 1.0, 1.0, 4.0, 1.0, 1.0, 1.0, 1.0, 1.0, 1.0, 1.0, 5.0, 1.0, 2.0, 1.0, 1.0, 1.0, 1.0, 1.0, 1.0, 4.0, 1.0, 1.0, 1.0, 2.0, 1.0, 6.0, 1.0, 1.0, 1.0, 1.0, 1.0, 3.0, 1.0, 1.0, 1.0, 1.0, 1.0, 1.0, 1.0, 1.0, 1.0, 2.0, 1.0, 1.0, 1.0, 1.0, 1.0, 2.0, 2.0, 1.0, 1.0, 2.0, 1.0, 1.0, 2.0, 2.0, 1.0, 1.0, 3.0, 1.0, 1.0, 1.0, 1.0, 1.0, 1.0, 1.0, 1.0, 1.0, 1.0, 1.0, 2.0, 1.0, 1.0, 1.0, 1.0, 1.0, 1.0, 3.0]
b = plt.hist(no_outbreak, bins=30)
plt.xscale("log")
plt.figure(figsize=(10, 7))
plt.hist(final_R, 20)
plt.xlabel("final size", fontsize=18)
plt.ylabel("runs", fontsize=18)
plt.xticks(fontsize=14)
plt.yticks(fontsize=14)
(array([  0., 100., 200., 300., 400., 500., 600., 700., 800.]),
 [Text(0, 0, ''),
  Text(0, 0, ''),
  Text(0, 0, ''),
  Text(0, 0, ''),
  Text(0, 0, ''),
  Text(0, 0, ''),
  Text(0, 0, ''),
  Text(0, 0, ''),
  Text(0, 0, '')])
len(no_outbreak)
263
In a stochastic SIR model, the probability of an outbreak is equal to
p_outbreak = 1 - 1 / R0
p_outbreak
0.6666666666666667
Of course, such fluctuations do not affect the deterministic model, where the outcome is fixed.
N = 10000
I = 1
S = N - I
R = 0


St = []
It = []
Rt = []

St.append(S)
It.append(I)
Rt.append(R)

while I > 0.5:
    deltaSI = beta1 * (float(I) * float(S) / N)
    deltaIR = mu * I

    S = S - deltaSI
    I = I + deltaSI - deltaIR
    R = R + deltaIR

    St.append(S)
    It.append(I)
    Rt.append(R)
print("The final attack rate is ", Rt[-1] / N)
The final attack rate is 0.9531700082169579
9.3. Epidemics on networks#
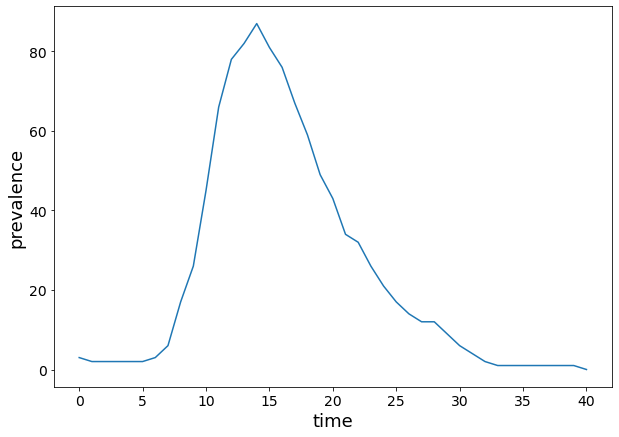
9.3.1. Stochastic SIR on the US airport network#
airport_path = "./../datasets/USairport_2010.txt"
meta_path = "./../datasets/USairport_2010_codes.txt"
G = nx.Graph()
fh = open(airport_path, "r")
for line in fh.readlines():
    s = line.strip().split()
    G.add_edge(int(s[0]), int(s[1]))
fh.close()
G.code = {}
G.name = {}
G.pos = {}

lons = []
lats = []

finfo = open(meta_path, "r")
for line in finfo.readlines():
    s = line.strip().split()
    node = int(s[0])

    lon = float(s[4])
    lat = float(s[3])

    G.code[node] = s[1]
    G.name[node] = s[2]
    G.pos[node] = [lon, lat]

    lons.append(lon)
    lats.append(lat)
finfo.close()
# disease parameters
mu = 0.2  # infectious period
lambd = 0.01  # probability of infection given a contact
# we need to store the disease status of each node
G.disease_status = {}  # S=0, I=1, R=-1

infected_nodes = []  # list of infected nodes
# let's choose a seed
node_list = []

deg = dict(G.degree())
for i in sorted(deg.items(), key=itemgetter(1)):
    node_list.append(i[0])
seed = node_list[-1]

print("The seed is", G.name[seed])
print("The degree of the seed is", G.degree(seed))
The seed is Denver
The degree of the seed is 192
seed
389
# initialize the network
infected_nodes.append(seed)

for n in G.nodes():
    if n in infected_nodes:
        G.disease_status[n] = 1
        # infected
    else:
        G.disease_status[n] = 0
        # susceptible
I_net = []

while len(infected_nodes) > 0:

    # transmission
    for i in infected_nodes:
        for j in G.neighbors(i):
            if G.disease_status[j] == 0:
                p = np.random.random()
                if p < lambd:
                    G.disease_status[j] = 1

    # recovery
    for k in infected_nodes:
        p = np.random.random()
        if p < mu:
            G.disease_status[k] = -1

    # update of disease status
    infected_nodes = []
    for n in G.nodes():
        if G.disease_status[n] == 1:
            infected_nodes.append(n)

    # store output
    I_net.append(len(infected_nodes))
plt.figure(figsize=(10, 7))

plt.xlabel("time", fontsize=18)
plt.ylabel("prevalence", fontsize=18)

plt.xticks(fontsize=14)
plt.yticks(fontsize=14)

plt.plot(range(0, len(I_net)), I_net)
[<matplotlib.lines.Line2D at 0x17f7161f0>]
recovered = 0
for n in G.nodes():
    if G.disease_status[n] == -1:
        recovered += 1

print("The total number of infected nodes is", recovered)
print("The final attack rate is", recovered / len(G.nodes()))
The total number of infected nodes is 216
The final attack rate is 0.5333333333333333
9.3.2. Visualize the infection spread on the network#
import geopandas as gpd
import pandas as pd
from shapely.geometry import Point
shape_path = "./../datasets/shapefiles/USA_shape.shp"
ls ./../shapefiles/
ls: ./../shapefiles/: No such file or directory
# we need to store the disease status of each node
G.disease_status = {}  # S=0, I=1, R=-1

infected_nodes = []  # list of infected nodes
# initialize the network
infected_nodes.append(seed)

for n in G.nodes():
    if n in infected_nodes:
        G.disease_status[n] = 1
        # infected
    else:
        G.disease_status[n] = 0
        # susceptible
t = 0
node_color = [G.disease_status[v] for v in G]  # color code on disease status
### Import the shapefile of the USA
usa = gpd.read_file(shape_path)
usa.plot(figsize=(12, 7))
<AxesSubplot:>

usa.head()
usa_cont = usa[
    (usa.NAME != "Alaska") & (usa.NAME != "Hawaii") & (usa.NAME != "Puerto Rico")
]
usa_cont.head()
usa_cont.plot(figsize=(12, 7))
usa_cont.crs
usa_cont_alb = usa_cont.to_crs({"init": "epsg:4326"}) #epsg:4326 esri:102003
usa_cont_alb.head()
ax = usa_cont_alb.plot(figsize=(12, 7), alpha=0.8)
from pyproj import Proj, transform
df = pd.read_csv(meta_path, sep=" ")
df
geo = [Point(xy) for xy in zip(df.lon, df.lat)]
crs = {"init": "epsg:4326"}
geo_df = gpd.GeoDataFrame(df, crs=crs, geometry=geo)
geo_df.crs
geo_df.plot(figsize=(10, 7))
original = Proj(geo_df.crs)  # EPSG:4326 in your case
destination = Proj(init="esri:102003")  # your new proj
G.pos_new = {}
for node in G:

    long, lat = G.pos[node]
    x, y = transform(original, destination, long, lat)

    G.pos_new[node] = (x, y)
ax = usa_cont_alb.plot(figsize=(12, 7), alpha=0.7)
nx.draw_networkx_nodes(
    G,
    pos=G.pos_new,
    node_size=30,
    node_color=node_color,
    cmap=plt.cm.RdBu_r,
    vmin=-1,
    vmax=1,
)
while len(infected_nodes) > 0 and t < 15:

    for i in infected_nodes:
        for j in G.neighbors(i):
            if G.disease_status[j] == 0:
                p = np.random.random()
                if p < lambd:
                    G.disease_status[j] = 1

    for k in infected_nodes:
        p = np.random.random()
        if p < mu:
            G.disease_status[k] = -1

    infected_nodes = []
    for n in G.nodes():
        if G.disease_status[n] == 1:
            infected_nodes.append(n)

    t += 1
    node_color = [G.disease_status[v] for v in G]  # color code on disease status

    plt.figure(figsize=(12, 7))
    ax = usa_cont_alb.plot(figsize=(12, 7), alpha=0.7)
    nx.draw_networkx_nodes(
        G,
        pos=G.pos_new,
        node_size=30,
        node_color=node_color,
        cmap=plt.cm.RdBu_r,
        vmin=-1,
        vmax=1,
    )

    # plt.savefig('./spreading_SIR_snapshot_time_'+str(t)+'.png')

